Learning Outcomes
This article explains how valuation is performed using the term structure of interest rates for CFA Level 1 fixed-income questions, including:
- Distinguishing par, spot, and forward yield curves, relating them to the relevant term structure, and interpreting typical curve shapes.
- Constructing a zero-coupon (spot) yield curve from coupon and zero-coupon bond prices using the bootstrapping procedure step by step.
- Translating spot rates into discount factors and using them within a strict no-arbitrage pricing framework for fixed-income securities.
- Valuing coupon bonds by discounting each cash flow at its maturity-specific spot rate and reconciling this with quoted yields-to-maturity.
- Calculating 1-period and multi-period forward rates implied by spot curves and linking them to alternative investment strategies.
- Interpreting forward rates as break-even future rates and recognizing their limitations as unbiased forecasts of future short-term rates.
- Handling annual versus semiannual compounding conventions when bootstrapping curves, valuing bonds, or computing forward rates on the exam.
- Identifying common exam pitfalls, such as misusing a single yield, confusing spot and forward rates, or misaligning cash-flow timing with discount factors.
CFA Level 1 Syllabus
For the CFA Level 1 exam, you are required to understand yield curves, bootstrapping, and term-structure-based valuation, with a focus on the following syllabus points:
- Describe the types and shapes of yield curves and their implications for interest rate expectations
- Explain and calculate spot rates and forward rates
- Construct a zero-coupon yield curve from the prices of coupon and zero-coupon bonds (bootstrapping)
- Use spot rates and discount factors to value fixed-income securities under a no-arbitrage framework
- Relate the term structure of interest rates to bond yields and prices
Test Your Knowledge
Attempt these questions before reading this article. If you find some difficult or cannot remember the answers, look more closely at that area during your revision.
-
Which statement best describes a par yield curve?
- a) It plots yields on zero-coupon bonds of different maturities.
- b) It plots yields-to-maturity on coupon bonds trading at par.
- c) It plots implied future short-term rates between periods.
- d) It plots historical average yields over different maturities.
-
A 1-year zero-coupon bond has a yield of 3%, and a 2-year zero-coupon bond has a yield of 3.5% (both annual compounding). The 1-year forward rate for year 2 is closest to:
- a) 3.25%
- b) 3.50%
- c) 4.00%
- d) 4.01%
-
When bootstrapping spot rates from coupon bond prices, the main idea is to:
- a) Use a single yield-to-maturity to discount all cash flows.
- b) Start from the longest maturity and work back to the shortest.
- c) Solve sequentially for each new spot rate using bonds with increasing maturities.
- d) Assume all bonds trade exactly at par.
-
Why are spot rates preferable to a single yield-to-maturity for bond valuation in a no-arbitrage framework?
- a) Spot rates are always lower than yields-to-maturity.
- b) Different cash flow maturities should be discounted at potentially different rates.
- c) Yield-to-maturity ignores coupon payments.
- d) Spot rates only apply to defaultable bonds.
Introduction
The term structure of interest rates, commonly visualized as a yield curve, is central to fixed-income valuation. Yield curves summarize how yields vary across maturities for bonds with similar credit quality and liquidity. Understanding the term structure helps you:
- Infer market expectations about future interest rates and inflation
- Price bonds and other fixed-income instruments
- Compare relative value across securities with different maturities
For valuation and risk management, we often need spot rates—yields on hypothetical zero-coupon bonds—for a range of maturities. In practice, zero-coupon bonds do not exist at every maturity, so analysts infer missing spot rates from the prices and coupons of traded bonds using a technique called bootstrapping.
Key Term: yield curve
A graphical representation that plots yields (interest rates) of bonds with identical credit quality but different maturities, describing the term structure of interest rates. Key Term: term structure of interest rates
The relationship between interest rates (or yields) and time to maturity for otherwise similar debt securities, usually illustrated by a yield curve. Key Term: spot rate
The yield or discount rate applicable to a single cash flow at a specific future date, equivalent to the yield on a zero-coupon bond maturing at that date. Key Term: forward rate
The implied interest rate for a future period that begins at a future date, derived from current spot rates under a no-arbitrage assumption. Key Term: bootstrapping
A step-by-step method for deriving spot rates from the prices of zero-coupon and coupon-bearing bonds by sequentially solving for each unknown discount rate. Key Term: discount factor
The present value today of 1 unit of currency to be received at a specific future time, calculated using the relevant spot rate for that maturity.
The following sections build from basic yield curve concepts to bootstrapping, then to valuation and forward rates, with a strong focus on the calculation mechanics and common exam traps.
Test Tip: When revising Yield curves and bootstrapping, connect each definition, method, or rule to the kind of question the assessment is likely to ask.
Yield Curves and Their Interpretation
A yield curve plots the yields of bonds with equal risk but different maturities. Governments’ default-free (or nearly default-free) bond yield curves are often used as reference curves.
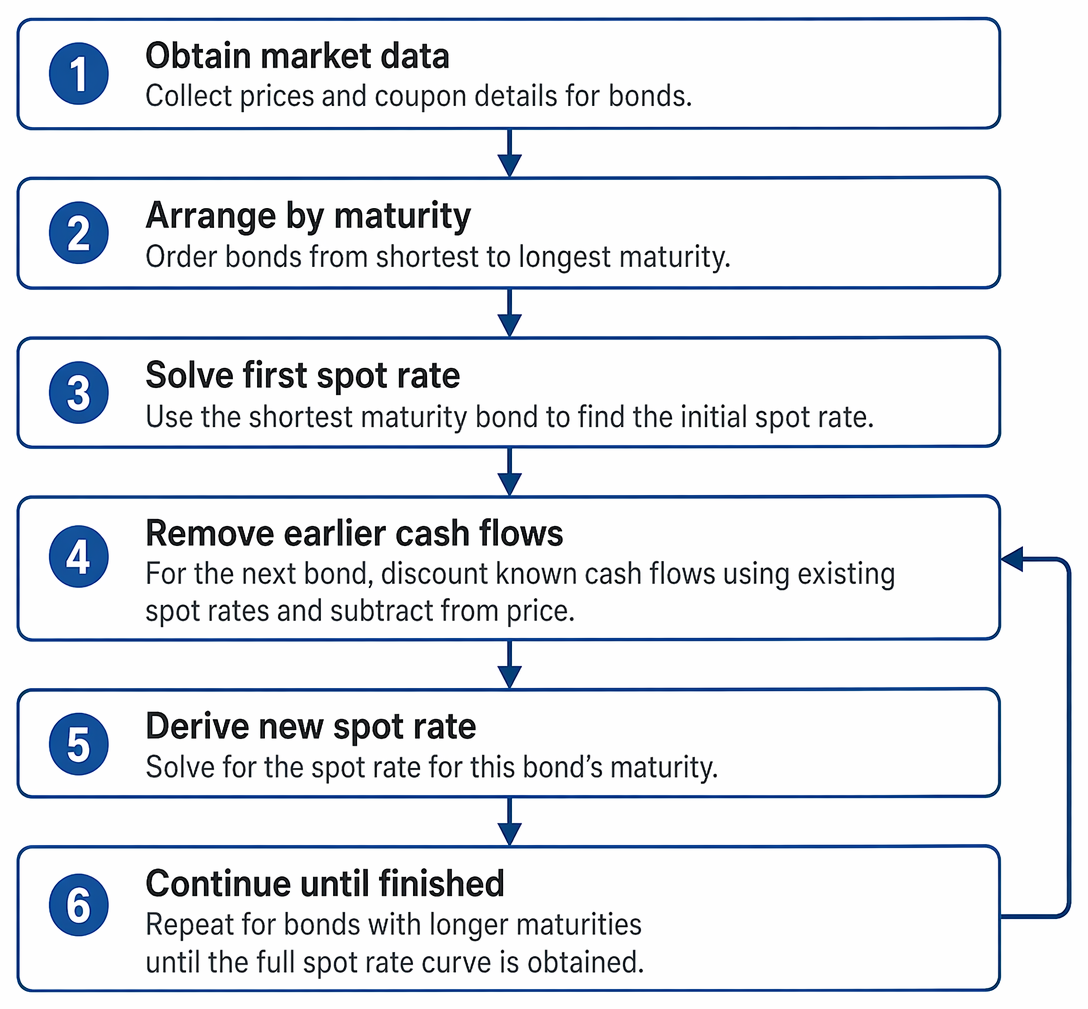
Sequential term-structure construction derives each maturity-specific spot rate from market bond cash flows discounted at previously solved rates.
The most common yield curve concepts for CFA Level 1 are:
- Par Yield Curve: Plots yields-to-maturity of coupon-paying bonds that are priced at par (price equals face value).
- Spot (Zero-Coupon) Yield Curve: Plots spot rates (zero-coupon yields) for each maturity.
- Forward Rate Curve: Plots implied forward rates between periods, derived from the spot rate curve.
Key Term: par yield curve
A curve showing, for each maturity, the coupon rate a bond must have to trade at par value, given current spot rates. Key Term: spot yield curve
A curve that shows the spot rate (zero-coupon yield) applicable to a single cash flow at each maturity. Key Term: forward rate curve
A curve that shows the series of implied forward rates between maturities, extracted from the spot yield curve.
Yield Curve Shapes
Several typical shapes appear in practice:
- Upward sloping (normal): Long-term yields are higher than short-term yields. Often associated with expectations of rising future short-term rates and/or positive term premia (extra yield for bearing interest rate risk).
- Downward sloping (inverted): Long-term yields are lower than short-term yields. Often interpreted as the market expecting lower future short-term rates, sometimes linked to expected economic slowdown.
- Flat: Yields are similar across maturities, suggesting little expectation of rate changes or offsetting influences of expectations and term premia.
- Humped: Yields are higher at intermediate maturities than at very short or very long maturities. This can occur when intermediate-term risk premia are relatively high.
For the exam, you should be able to:
- Recognize these shapes graphically
- State what each shape implies about expectations for future short-term interest rates (recognizing that in reality risk premia also matter)
Par, Spot, and Forward Curves: How They Relate
The three main curves are mathematically linked:
- Given a full spot curve, you can compute the par rate for any maturity by setting the bond price equal to par and solving for the coupon rate.
- Given the spot curve, you can compute forward rates by ensuring no-arbitrage between investing in one longer period or rolling over shorter periods.
- Given sufficient bond prices, you can bootstrap the spot curve from market data (typically starting from short maturities and progressing outward).
Exam questions may give you any one of these curves and ask you to derive another, or use them to value a bond.
Bootstrapping the Zero-Coupon Curve
Zero-coupon bonds are not available at all maturities, and most traded bonds are coupon-bearing. Bootstrapping allows you to derive missing spot rates from coupon bond prices under a no-arbitrage assumption: the value of a set of cash flows must be the same regardless of how you replicate them.
The general idea:
- Use the price of the shortest maturity bond to find the first spot rate.
- Use that spot rate to strip out the present value of early cash flows from the next maturity bond, then solve for the new (longer) spot rate.
- Repeat, working step by step out along the curve.
For annual coupon bonds with face value 100, the price of an -year bond with coupon rate per year can be written as:
where:
- is the t-year spot rate
- The only unknown when pricing the n-year bond is (previous spot rates have already been found)
Worked Example 1.1
Suppose you have the following risk-free, annual-coupon bonds (prices per 100 face value):
- 1-year zero-coupon: Price = 97.09
- 2-year 5% coupon: Price = 98.40
- 3-year 6% coupon: Price = 99.05
Find the 1-, 2-, and 3-year spot rates.
Answer:
1-year bond (zero-coupon):
2-year bond (5% coupon):
Substituting:
3-year bond (6% coupon):
Substitute s_1 and s_2:
So:
You have now bootstrapped the first three spot rates from bond prices.
Discount Factors
Once spot rates are known, you can compute discount factors:
For Example 1.1:
These discount factors represent the present value of 1 unit of currency to be received at each future date and can be used directly in pricing any bond with matching maturities.
Key Term: zero-coupon yield curve
The curve of spot rates or discount factors for all maturities, implied by zero-coupon bonds or constructed via bootstrapping from coupon bond prices.
Semiannual Coupons and Bootstrapping
Many exam questions involve semiannual coupon bonds. The logic is identical, but:
- Coupon per period = annual coupon rate × (par) ÷ 2
- Number of periods = years to maturity × 2
- Spot rates and discounting are expressed per half-year (then often annualized by multiplying by 2 for reporting)
You may be given periodic spot rates directly, or you may need to bootstrap them from semiannual coupon bond prices.
Exam Warning: A common exam error is to use a single yield-to-maturity to discount all cash flows. That yields the correct bond price when you solve for yield-to-maturity as the internal rate of return (IRR), but it is not how markets enforce no-arbitrage across different maturities. For no-arbitrage valuation, each cash flow should be discounted using its corresponding spot rate or discount factor.
Spot Rates and Bond Valuation
Plain-vanilla coupon bonds are valued by discounting each cash flow at the appropriate spot rate for its maturity. This gives the no-arbitrage price:
where:
- is the cash flow at time (coupon or coupon + principal)
- is the i-year spot rate
Alternatively, using discount factors:
Using spot rates aligns the valuation with the market term structure and is consistent with the pricing of all other bonds used to construct the curve.
Worked Example 1.2
A 2-year bond pays a 4% annual coupon on a 100 face value (so 4 per year) and 100 at maturity. Spot rates are and . What is the fair price?
Answer:
Cash flows: Year 1: 4 Year 2: 104 Price:
The bond trades essentially at par because its coupon rate is close to the term-structure-consistent yield for its cash flows.
Yield-to-Maturity vs Spot-Rate Valuation
- Yield-to-maturity (YTM) is the single discount rate that makes the present value of all cash flows equal to the bond price. It is an average rate across maturities.
- Spot-rate valuation discounts each cash flow at its own maturity-specific rate.
If the spot curve is flat, using a single YTM or spot rate gives the same price. When the curve is not flat, spot-rate valuation ensures consistency with all other bond prices used to construct the curve.
Link to Z-Spread (Context)
At Level I you may also see the zero-volatility spread (Z-spread):
Key Term: zero-volatility spread (Z-spread)
The constant yield spread added to each point on a benchmark spot curve such that the present value of a bond’s cash flows equals its market price.
The Z-spread is calculated with the same discount-factor approach:
where are benchmark spot rates (for example, government spot rates) and is the constant spread. The mechanics are similar to bootstrapping; both rely on discounting each cash flow at a maturity-appropriate rate.
Forward Rates
Forward rates represent the market-implied interest rates for future periods, derived from current spot rates under the no-arbitrage principle.
For annual compounding, the relationship between spot rates and a 1-year forward rate from year to year is:
so:
Key Term: forward rate
The rate that makes an investor indifferent between investing in a longer-term bond versus rolling over shorter-term investments, given current spot rates and no-arbitrage.
Worked Example 1.3
If and (annual compounding), what is the implied 1-year forward rate for year 2?
Answer:
Use:
General Forward Rate Between Two Dates
For a forward rate starting at time and ending at time (with annual compounding):
so:
You are not expected to derive this formula on the exam, but you should recognize the relationship and be able to apply it when given the spot rates.
Worked Example 1.4
Suppose:
Both are annual rates. What is the implied 2-year forward rate from year 1 to year 3 ()?
Answer:
Use:
Compute:
(per year over years 1–3)
Interpreting Forward Rates
Forward rates can be interpreted as:
- The break-even future rates that make long- and short-term investment strategies equivalent in present value terms
- Indicators of the market’s expectations about future short-term rates plus any term premia
For exam purposes, you should:
- Be able to compute forward rates from spot rates
- Recognize that an upward-sloping spot curve generally implies forward rates above current short rates, and vice versa
Bootstrapping, Spot Curves, and the Exam
On the exam, bootstrapping and term-structure questions typically test:
- Setting up the pricing equation for each bond used in the bootstrap
- Substituting previously derived spot rates to solve for the next one
- Translating spot rates into discount factors
- Using the resulting spot curve to value another bond
- Computing forward rates from the spot curve
Practical Bootstrapping Steps (Annual Coupons)
For each maturity :
- Step 1: Write the present value equation for the n-year bond using spot rates .
- Step 2: Substitute the known spot rates and the bond's price.
- Step 3: Collect terms so that only the cash flow at time remains unknown.
- Step 4: Solve for , then compute the discount factor .
Worked Example 1.5 (Conceptual)
You observe:
- A 1-year 4% annual coupon bond priced at 100
- A 2-year 5% annual coupon bond priced at 99
Both have face value 100 and identical credit risk. Find the 1-year and 2-year spot rates.
Answer:
1-year bond at par:
This simplifies to:
because a bond priced at par has coupon rate equal to its yield, and with a single-period bond yield equals the spot rate. 2-year bond:
Substitute:
The resulting spot curve is upward sloping: 1-year spot rate of 4% and 2-year spot rate of about 5.57%.
Exam Pitfalls and Tips
- Do not mix up spot rates and YTM. If a question gives you a YTM and asks for the spot rate curve, you must bootstrap or be given additional information.
- Keep track of compounding frequency. If spot rates are quoted with semiannual compounding, write cash flows and discount factors consistently in half-year periods.
- Label periods clearly on your calculator and in your workings, especially when solving for forward rates (e.g., vs ).
- When time is short, write the cash flow schedule before setting up equations—this reduces the risk of missing or misplacing a cash flow.
Key Point Checklist
This article has covered the following key knowledge points:
- Interpret the term structure of interest rates and typical yield curve shapes
- Distinguish among par, spot, and forward yield curves and understand how they are related
- Apply the bootstrapping process step by step to derive spot rates from bond prices
- Compute discount factors from spot rates and use them for bond valuation
- Value coupon bonds by discounting each cash flow at its corresponding spot rate
- Calculate 1-period and multi-period forward rates from spot rates and interpret what they imply
- Recognize why spot-rate valuation reflects no-arbitrage more directly than a single yield-to-maturity approach
- Understand how the Z-spread uses the spot curve framework to measure yield spreads
Key Terms and Concepts
- yield curve
- term structure of interest rates
- spot rate
- forward rate
- bootstrapping
- discount factor
- par yield curve
- spot yield curve
- forward rate curve
- zero-coupon yield curve
- zero-volatility spread (Z-spread)