Learning Outcomes
This article explains how to analyze REIT performance using FFO and AFFO, including:
- Defining FFO and AFFO and distinguishing them from net income, EBITDA, NOI, and cash flow from operations, and explaining why they are preferred sector-specific metrics.
- Computing FFO from net income by adjusting for real estate–related depreciation and amortization, impairments, and gains or losses on property sales in line with CFA Level 2 conventions.
- Deriving AFFO from FFO by removing non-cash rent (straight-line and similar items) and deducting maintenance capex and recurring leasing-related capitalized costs, while separating maintenance from discretionary growth capex.
- Interpreting FFO and AFFO levels, trends, and payout ratios to assess portfolio operating performance, leverage, dividend coverage, and dividend growth capacity.
- Applying FFO- and AFFO-based valuation and credit metrics—such as P/FFO, P/AFFO, FFO and AFFO yields, debt-to-FFO, and interest-coverage ratios—in exam-style item sets and linking these measures to property-level metrics (NOI, cap rates), FCFE concepts, and total return expectations.
- Recognizing common exam traps involving non-real-estate depreciation, one-off or non-cash items, timing differences in leasing costs, and inconsistent AFFO definitions across REITs, and adjusting calculations accordingly.
- Integrating FFO/AFFO analysis with macroeconomic drivers of discount rates and growth (for example, interest rates, inflation, and GDP), consistent with the broader equity valuation and economics readings.
CFA Level 2 Syllabus
For the CFA Level 2 exam, you are required to understand analytical metrics for public real estate securities, with a focus on the following syllabus points:
- Distinguishing and calculating FFO and AFFO for equity REITs.
- Explaining why FFO and AFFO are preferred to net income, EBITDA, or CFO when assessing REIT performance and dividend capacity.
- Evaluating strengths, weaknesses, and comparability issues of FFO and AFFO as proxies for cash flow.
- Using FFO and AFFO in equity REIT valuation (for example, price/FFO, price/AFFO, and FFO yield) and in dividend and credit analysis.
- Interpreting REIT financial disclosures to identify maintenance versus growth capital expenditures and non-recurring items.
- Recognizing that FFO and AFFO are non-GAAP, non-IFRS measures and understanding implications for disclosure quality and comparability.
- Combining FFO/AFFO analysis with broader tools from equity valuation, financial statement analysis, and macroeconomics in case-based item sets.
- Relating FFO and AFFO to property-level metrics (NOI, cap rates) and macro drivers of discount rates and risk premiums for commercial real estate.
- Connecting REIT-specific multiples (P/FFO, P/AFFO) to the general Gordon growth and justified P/E framework from equity valuation.
Test Your Knowledge
Attempt these questions before reading this article. If you find some difficult or cannot remember the answers, look more closely at that area during your revision.
Analyst Lee is reviewing the financial statements of CityCore REIT, an equity REIT that owns office and retail properties. The following information (in millions, except per share data) is available for the current year:
- Net income attributable to common shareholders: 120
- Depreciation and amortization of real estate assets: 80
- Depreciation of corporate equipment: 4
- Gain on sale of an office building: 15
- Impairment write-down of a retail property: 6
- Straight-line rent revenue recognized in excess of cash rent received: 5
- Recurring maintenance capital expenditures: 18
- Expansion (growth) capex for new development: 40
- Capitalized leasing commissions and tenant improvements (recurring): 7
- Dividends paid to common shareholders: 110
- Shares outstanding: 50 million
Assume all items are real estate–related unless otherwise stated.
-
Based on the information given (and ignoring any company-specific definitions), CityCore REIT’s FFO is closest to:
- a) 191 million
- b) 191 million (excluding impairment write-down)
- c) 191 million (excluding impairment and adding back equipment depreciation)
- d) 201 million
-
CityCore REIT’s AFFO (using the standard CFA approach) is closest to:
- a) 161 million
- b) 166 million
- c) 171 million
- d) 179 million
-
CityCore REIT’s AFFO payout ratio (dividends ÷ AFFO), using your answer from Question 2, is closest to:
- a) 57%–60%
- b) 64%–68%
- c) 72%–76%
- d) Above 90%
-
Which conclusion about CityCore’s dividend sustainability and growth prospects is most appropriate based on your answers?
- a) The dividend is clearly unsustainable because dividends exceed both FFO and AFFO.
- b) The dividend appears sustainable, and there is clear room for dividend growth without relying on asset sales or new debt.
- c) The dividend is roughly in line with AFFO, leaving limited buffer; future dividend growth will likely require FFO/AFFO growth or external capital.
- d) The dividend analysis is inconclusive because FFO and AFFO provide no information about dividend capacity.
Introduction
Analysis of real estate investment trusts (REITs) in the CFA Level 2 curriculum requires understanding financial metrics tailored to the sector’s unique characteristics. Equity REITs are highly capital-intensive, own long-lived real estate that often holds or increases its value, and are typically required (by tax regulation in many jurisdictions) to distribute a large percentage of taxable income as dividends to maintain REIT status. This combination of high depreciation, long-term leases, and high payout requirements makes conventional accounting earnings (net income) a poor proxy for economic performance.
Key Term: Real estate investment trust (REIT)
A real estate investment trust is a company that owns, operates, or finances income-producing real estate and is structured to receive favorable tax treatment if it satisfies regulatory requirements, including limits on activities and minimum payout ratios of taxable income as dividends. Key Term: Equity REIT
An equity REIT primarily owns and operates income-producing properties (such as offices, apartments, industrial facilities, healthcare facilities, data centers, and shopping centers). It earns rental income and related fees, in contrast to a mortgage REIT, which primarily holds real estate debt. Key Term: Mortgage REIT
A mortgage REIT primarily invests in real estate–related debt instruments such as mortgages and mortgage-backed securities. It earns interest income rather than rental income; FFO and AFFO analysis for mortgage REITs uses different sector metrics, so Level 2 focuses on equity REITs.
In many REIT regimes (for example, in the United States), maintaining REIT status requires:
- Distributing a high proportion (often at least 90%) of taxable income as dividends.
- Deriving the majority of income from real estate–related sources.
- Holding predominantly real estate assets and real estate–backed securities.
These constraints limit retained earnings and push REITs to fund growth through external capital (new debt or equity). That makes payout capacity and access to capital markets central to REIT analysis, and it explains why REIT-specific cash flow measures such as FFO and AFFO are heavily used.
Under both IFRS and US GAAP, real estate held under the cost model is depreciated on the income statement even though the assets may not economically depreciate in the same way as plant or equipment. Over long periods, real estate can even appreciate in value, especially in prime locations. As a result, traditional net income often understates a REIT’s true earnings power and cash-generating capacity.
IFRS also allows many investment properties to be measured at fair value, with changes in value recognized in profit or loss. In such cases, net income becomes volatile and heavily influenced by appraisal-based fair value movements that do not reflect cash generation. Whether the REIT uses a cost model or fair value model, net income is not designed to capture sustainable, recurring cash flows to equity investors.
In addition, periodic realized gains on property sales and irregular non-cash charges (for example, impairments) further distort comparability over time and across REITs. Analysts therefore look for sector-specific measures that remove these distortions.
At the property level, one widely used measure is net operating income.
Key Term: Net operating income (NOI)
Net operating income is property-level income before interest, taxes, depreciation, and corporate overhead, generally calculated as rental and other property income minus property-level operating expenses (such as utilities, repairs, insurance, and property taxes).
NOI is useful for assessing asset quality, lease terms, and property-level returns, and it links directly to property valuation via capitalization rates. However, NOI omits important elements (corporate overhead, interest, and capital expenditures) that determine how much cash ultimately accrues to equity holders. Sector practitioners therefore supplement NOI with REIT-specific earnings and cash flow measures.
To address these issues, the REIT industry and analysts rely heavily on two sector-specific performance metrics:
Key Term: Funds from operations (FFO)
Funds from operations is a performance metric for equity REITs that starts from net income and adjusts for real estate–related depreciation, amortization, and gains or losses on property sales, along with certain non-recurring items, to provide a better measure of recurring earnings from property operations than conventional net income. Key Term: Adjusted funds from operations (AFFO)
Adjusted funds from operations refines FFO by removing the impact of non-cash rent accounting (for example, straight-line rent) and subtracting maintenance capex and recurring leasing-related cash outflows, aiming to approximate sustainable cash available for distribution to equity holders.
At Level 2, you are expected to:
- Reconstruct FFO and AFFO from partial financial statement data.
- Distinguish maintenance from growth capex when estimating AFFO.
- Interpret FFO- and AFFO-based multiples and payout ratios when forming an investment view under exam-style time pressure.
- Spot and correct misclassifications of items that affect FFO and AFFO.
- Link these measures back to broader valuation frameworks, including dividend discount models and relative valuation using multiples.
- Integrate REIT-specific analysis with macroeconomic and interest-rate views, given real estate’s sensitivity to the business cycle and funding conditions.
Although the syllabus sits within “Real estate and infrastructure,” the techniques here are primarily for equity REITs. Many listed infrastructure vehicles (for example, some pipeline companies or yield-oriented infrastructure funds) report similar non-GAAP metrics, but the precise definitions differ. In exam questions, treat each metric according to the definition given in the vignette.
Finally, remember the general valuation principle from the equity and economics readings: the value of any asset is the present value of expected future cash flows discounted at an appropriate risk-adjusted rate. FFO and AFFO are ways of describing those cash flows for REIT equity; the required return reflects the real risk-free rate, expected inflation, and a risk premium for the uncertainty of those REIT cash flows. The sections that follow develop these skills step by step.
Test Tip: When revising REIT metrics FFO and AFFO, connect each definition, method, or rule to the kind of question the assessment is likely to ask.
Exam Warning: Do not rely on keyword recognition alone; check the precise condition, exception, calculation step, or evidence the question requires.
FFO: Real Estate Cash Flow Proxy
Standard net income can be misleading for REITs because it includes:
- Large non-cash depreciation and amortization charges on real estate assets, which often do not correspond to economic declines in value.
- Gains and losses from property sales that are irregular and not part of ongoing operations.
- Non-cash impairment charges that may be sporadic and driven by changes in appraisals or management assumptions rather than permanent economic losses.
- Results from non-core businesses (for example, one-off development-for-sale projects) that may be cyclical and lumpy.
FFO attempts to remove these distortions by focusing on the recurring earnings stream from income-producing properties.
FFO Formula
There is no IFRS or US GAAP definition of FFO, but in practice REITs in many markets follow guidance from industry bodies (for example, NAREIT in the United States or EPRA in Europe) and supplement this with company-specific disclosure. For the exam, use the definition implied by the case facts or, if not specified, the standard curriculum version:
\text{FFO} &= \text{Net income attributable to common shareholders} \\ &+ \text{Depreciation and amortization of real estate and tenant-related intangibles} \\ &+ \text{Real estate impairment write-downs (if treated as non-cash)} \\ &- \text{Gains on sales of depreciable real estate} \\ &+ \text{Losses on sales of depreciable real estate} \\ &\pm \text{Other specified non-recurring items related to property operations} \end{aligned}$$ Key points: - Add back depreciation and amortization on real estate assets and tenant-related intangibles, because those charges are non-cash and often do not reflect economic loss of value. - Remove gains and losses on sales of depreciable properties, because these are transaction-driven and not part of recurring property income. They are more relevant for assessing capital recycling strategy and net asset value (NAV) than for recurring earnings. - Typically add back non-cash impairment write-downs of real estate. The curriculum usually assumes impairment is non-cash, but a vignette may tell you otherwise (for example, an impairment triggered by physical damage not covered by insurance); then follow the vignette. - Ignore non-real-estate depreciation and amortization (for example, on IT equipment or office furniture) unless the question explicitly tells you otherwise. > **Exam warning:** FFO should include only depreciation and amortization related to real estate assets and tenant-related intangible assets (for example, in-place leases, tenant relationships). Amortization of financing costs, bond issuance costs, and depreciation of non-real-estate assets (for example, office equipment, IT hardware) should not be added back when computing FFO, unless the vignette explicitly instructs you to do so. For per-share analysis: $$\text{FFO per share} = \frac{\text{FFO}}{\text{Weighted average common shares outstanding}}$$ > **Key Term: FFO per share** > FFO per share is total FFO divided by the weighted average number of common shares outstanding, analogous to EPS for traditional companies and used in P/FFO and FFO yield calculations. FFO per share plays a similar role to EPS in conventional equity analysis and is the basis for P/FFO multiples and FFO-based payout and coverage ratios. #### IFRS versus US GAAP considerations The treatment of investment properties under IFRS can affect the starting point for FFO: - Under the cost model, investment properties are depreciated. Real estate depreciation appears in the income statement and is added back in the FFO calculation, similar to US GAAP. - Under the fair value model, investment properties are not depreciated. Instead, changes in fair value are recognized in profit or loss. In such cases: - There is little or no real estate depreciation to add back. - Large, often volatile fair value gains or losses should be removed from FFO as non-recurring, non-cash items. Exam vignettes usually state whether you are dealing with cost-model or fair-value-model properties and will identify which charges are real estate–related. In both frameworks, acquisitions often generate intangible assets such as “in-place leases” or “tenant relationships.” The amortization of these tenant-related intangibles is commonly added back in FFO, because it is non-cash and directly tied to leasing the property rather than a decline in economic value. A subtle exam detail is that IFRS fair value gains or losses can be very large; if you fail to strip them out when computing “normalized” FFO, you will misinterpret both valuation multiples and payout ratios. Under the cost model, the opposite risk is forgetting to add back real estate depreciation. From a financial reporting standpoint, many REITs also hold financial assets (for example, minority stakes in property companies or mortgage securities) that are accounted for under IFRS 9 (fair value through profit or loss or through OCI). Fair value changes on those instruments may pass through profit or loss; unless the vignette explicitly treats them as part of FFO, they are typically excluded from FFO to keep the metric focused on core rental operations. ### Comparing FFO to Net Income, EBITDA, and NOI It is helpful to position FFO relative to more familiar metrics. - Compared with net income, FFO: - Is almost always higher, because it adds back real estate depreciation and, often, impairment. - Is smoother, because it strips out property sale gains and losses and sometimes other one-offs. - Still includes corporate G&A, interest, and taxes, so it remains an equity-level metric. - Compared with EBITDA: - EBITDA excludes interest and taxes and adds back all depreciation and amortization, including non-real-estate and financing-related items. - FFO is after interest and taxes but adjusts only specific real estate items. It therefore lies conceptually between net income and EBITDA. - For cross-sector comparisons (for example, comparing a REIT to an infrastructure company), EV/EBITDA can be useful; for intra-REIT comparisons, P/FFO is more standard. - Compared with NOI: - NOI is a property-level metric: rental and other property income minus property-level operating expenses. It excludes corporate overhead, interest, and taxes and ignores how properties are financed. - FFO is a company-level metric: it reflects portfolio NOI minus corporate G&A, interest, and taxes, plus or minus the FFO-specific adjustments. - Changes in FFO can be driven by: - Organic growth in NOI (for example, rent increases, occupancy gains). - Acquisitions or dispositions. - Changes in leverage and interest costs. - Changes in corporate overhead. Analysts often reconcile NOI → operating income → net income → FFO to see where value is being created or consumed and to distinguish operational issues (NOI) from capital structure or overhead issues. In some vignettes, you may be given only segment-level NOI, corporate expenses, and interest. You should then: - Aggregate NOI across properties or segments. - Subtract corporate G&A and interest. - Apply any tax adjustment. - Then apply FFO adjustments (add back real estate depreciation, remove gains on sale, and so on). This walkthrough approach is frequently tested and forces you to keep track of the different “layers” of the income statement. ### Strengths and limitations of FFO From a curriculum standpoint, you should be able to evaluate FFO as well as compute it. - Strengths: - Removes major non-cash charges that systematically depress net income for real estate owners. - Excludes volatile, transactional items (property sales), improving comparability across periods. - Is widely disclosed by REITs and widely used by equity and credit analysts, making it practical for peer comparison. - Limitations: - Does not deduct maintenance capital expenditures; a REIT can have high FFO but poor-quality or very capital-intensive assets. - Is not fully standardized: some issuers add further adjustments (“normalized” or “core” FFO), which complicates comparison. - Includes the effect of leverage (interest expense); highly levered REITs can show weak FFO despite strong properties. - Still includes some non-cash items (for example, non-real-estate depreciation) and accounting estimates (for example, bad debt provisions). On exam item sets, you may be asked to comment on whether FFO is a good proxy for “cash available for distribution.” The most appropriate answer is typically: FFO is a useful proxy for recurring earnings, but because it ignores maintenance capex and some non-cash rent effects, AFFO is a better proxy for sustainable distributable cash. ### Worked Example 1.1 A REIT reports the following (in millions): - Net income attributable to common shareholders: 40 - Depreciation of investment properties: 12 - Gain on sale of a building: 6 - Impairment loss on a property: 2 Assume depreciation and impairment are real estate–related and treated as non-recurring non-cash items for FFO purposes. Calculate FFO. > **Answer:** > Start from net income and adjust for real estate depreciation, gains on sale, and impairment. > > - Net income: 40 > - Add back depreciation of real estate: +12 > - Subtract gain on sale of property (non-recurring): −6 > - Add back impairment loss (non-cash): +2 > > $$> \text{FFO} = 40 + 12 - 6 + 2 = 48 \text{ million}$$ > > FFO (48) exceeds net income (40) because depreciation and the impairment loss are non-cash charges, while the gain on sale is excluded as non-recurring. ### Additional FFO Considerations for the Exam When analyzing FFO in exam questions, pay attention to: - Net income attributable to common Many vignettes present “net income” including non-controlling interests and preferred dividends. FFO is normally calculated for common shareholders, so: - Subtract preferred dividends. - Adjust for non-controlling interests (for example, add back non-controlling interest share of FFO, or calculate FFO attributable only to the parent, as specified). - Joint ventures and unconsolidated affiliates REITs often hold partial interests in properties through joint ventures. Under both IFRS and US GAAP, such interests are typically accounted for using the equity method. The case may provide: - Equity in earnings of unconsolidated affiliates (which is after depreciation, interest, and tax at the JV level), or - FFO from unconsolidated joint ventures on a proportionate basis. For a “look-through” FFO figure, you will usually add the REIT’s share of unconsolidated FFO to consolidated FFO when assessing leverage or valuation. Be careful not to double-count depreciation add-backs: if JV earnings are already an FFO-like number, do not add back additional depreciation to that portion. - Non-real-estate operations Some REITs run ancillary businesses (for example, third-party property management services, development-for-sale activities, or hotel operations in mixed-use assets). The exam may ask you to: - Include all segments in FFO, or - Focus only on recurring rental operations, excluding non-core or volatile segments. The instructions in the vignette govern. - Acquisition and transaction costs Under some accounting frameworks, acquisition-related costs are expensed as incurred. Many REITs exclude material one-time transaction costs when presenting “normalized” FFO, arguing that they are non-recurring. In exam items, treat these costs as part of FFO unless the vignette explicitly instructs you to exclude them. - Impairment and restructuring charges - Real estate impairment: usually non-cash and added back in FFO. - Restructuring charges: may be cash (for example, severance, lease termination penalties) and may or may not be classified as non-recurring. Unless the vignette explicitly tells you to exclude a restructuring charge from FFO, leave it in. A common trap is over-adjusting by removing all “ugly” items. - Disclosure quality and non-GAAP measures Because FFO is non-GAAP and non-IFRS, management has discretion in defining “company FFO.” From the broader financial reporting quality reading, remember that management sometimes reclassifies gains or losses to present smoother results. When you see large differences between “reported FFO” and “NAREIT FFO,” or numerous “adjustments,” you should: - Read note disclosures carefully. - Rebuild FFO using the exam definition if required. - Treat aggressive adjustments as a potential quality-of-earnings red flag. > **Exam warning:** A frequent error is to add back all depreciation and amortization to net income. For FFO, only add back depreciation and amortization that relate to real estate and tenant intangibles. Depreciation of vehicles, IT equipment, or furniture remains an expense in FFO unless the case explicitly says otherwise. ### Worked Example 1.2 A REIT reports for the current year (in millions): - Net income attributable to common: 95 - Depreciation and amortization of investment properties: 60 - Amortization of deferred financing costs: 3 - Loss on sale of a property: 5 - Depreciation of corporate IT equipment: 2 Compute FFO assuming all property-related items are real estate–related. > **Answer:** > Start from net income and adjust only for real estate items and gains or losses on sale. > > - Net income: 95 > - Add back real estate depreciation and amortization: +60 > - Add loss on sale of depreciable property: +5 > - Do not add back amortization of deferred financing costs (financing-related). > - Do not add back depreciation of corporate IT equipment (non-real-estate). > > $$> \text{FFO} = 95 + 60 + 5 = 160 \text{ million}$$ > > An exam trap here is to add back all depreciation and amortization (including the IT equipment and financing costs). That would overstate FFO relative to accepted practice. ### Worked Example 1.3 – FFO Under IFRS Fair Value A REIT applying the IFRS fair value model reports (in millions): - Net income attributable to common: 70 - Net unrealized gain on revaluation of investment properties: 25 - Depreciation of corporate equipment: 3 There is no real estate depreciation because properties are at fair value. Compute FFO. > **Answer:** > Under the fair value model, fair value gains and losses are non-cash and should be removed from FFO. > > - Net income: 70 > - Subtract unrealized fair value gain on properties: −25 > - Do not adjust for corporate equipment depreciation: 0 > > $$> \text{FFO} = 70 - 25 = 45 \text{ million}$$ > > Here, net income (70) overstates recurring earnings because it includes a large unrealized gain. FFO (45) better reflects cash-oriented performance. ### AFFO: Estimating True Distributable Cash While FFO is a significant improvement over net income, it can still overstate the cash that a REIT can sustainably distribute, because FFO does not: 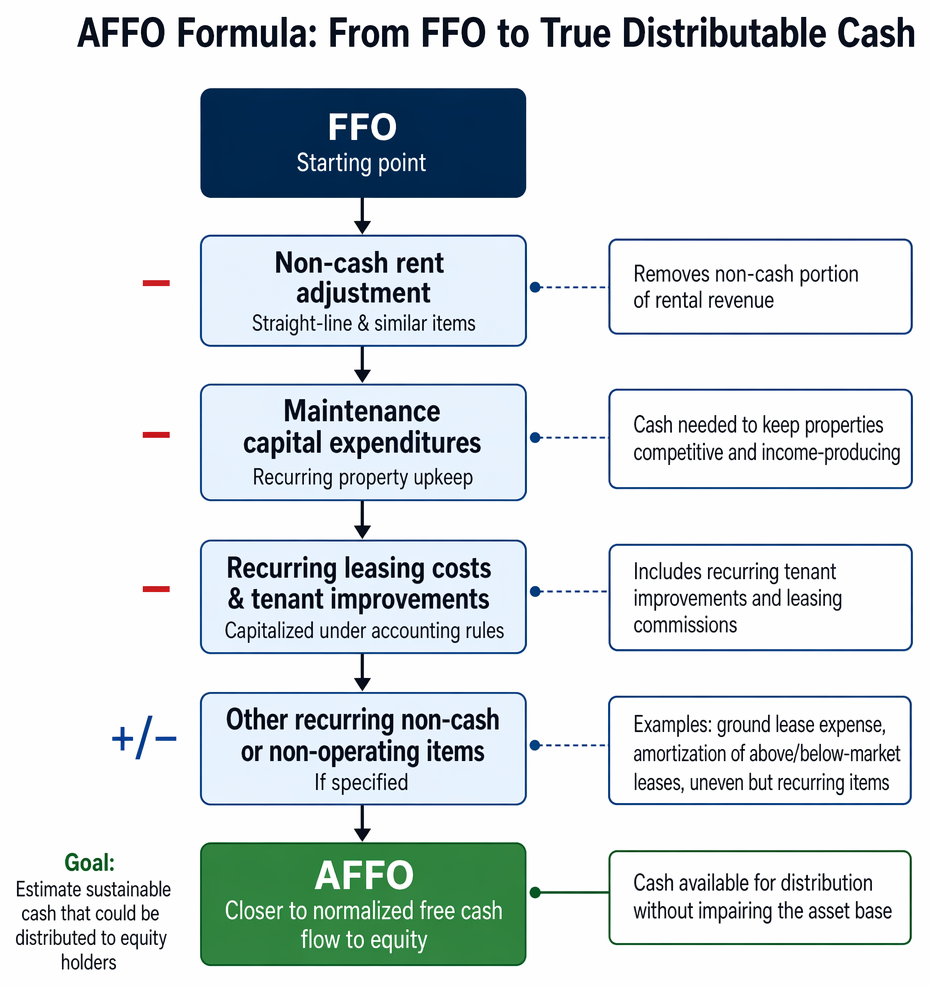 _Funds from operations excludes non-real-estate depreciation add-backs and adjusts net income for real estate depreciation, impairments, and property sale gains or losses._ - Deduct recurring maintenance-type capital expenditures needed to keep properties competitive and income-producing. - Adjust for non-cash components of rental revenue, especially those arising from straight-line rent accounting and amortization of lease incentives. - Fully reflect recurring leasing-related cash outflows, such as tenant improvements and leasing commissions that are capitalized under accounting standards. AFFO improves on FFO by incorporating these factors and is therefore closer to a “normalized free cash flow to equity” for a REIT. ### AFFO Formula A typical curriculum-style AFFO formulation is: $$\begin{aligned} \text{AFFO} &= \text{FFO} \\ &- \text{Non-cash rent from straight-line and similar lease accounting} \\ &- \text{Recurring maintenance capital expenditures} \\ &- \text{Recurring capitalized leasing costs and tenant improvements} \\ &\pm \text{Other recurring non-cash or non-operating adjustments (if specified)} \end{aligned}$$ > **Key Term: Straight-line rent adjustment** > Straight-line rent adjustment is the difference between rental revenue recognized on a straight-line (average) basis over the lease term under accounting rules and the actual contractual cash rent received in the period. When computing AFFO, analysts remove this non-cash portion of rent to focus on cash-based rental income. > **Key Term: Maintenance capital expenditures** > Maintenance capital expenditures are recurring expenditures required to maintain existing properties in their current condition and income-generating capacity (for example, roof replacement, major HVAC repairs, periodic refurbishment of common areas). They are deducted in AFFO to reflect the cash needed to sustain current operations. > **Key Term: Adjusted funds from operations** > Adjusted funds from operations (AFFO) is FFO adjusted for non-cash rent items, recurring maintenance capex, and recurring leasing-related cash outflows, intended to approximate sustainable cash that could be distributed to equity holders without impairing the asset base. In practice, practitioners sometimes approximate AFFO starting from cash flow from operations (CFO): $$\text{AFFO} \approx \text{CFO} - \text{Maintenance capex} \pm \text{Selected non-cash or non-recurring adjustments}$$ However, for exam purposes you should always use the formulation specified in the vignette, which typically starts from FFO. From an analytical standpoint, AFFO is conceptually similar to a steady-state free cash flow to equity: the cash that could be distributed without shrinking the asset base or impairing operations, assuming no new development or acquisitions. ### Distinguishing Maintenance versus Growth Capex A critical AFFO concept is the distinction between: - Maintenance (or sustaining) capex: Spending required to keep the property competitive and operational at its current standard and to maintain current NOI. Examples: - Replacing a worn-out roof on an existing building. - Replacing elevators with equivalent modern units. - Resurfacing parking lots. - Routine refurbishment of units between tenants, to maintain current rent levels. - Growth or expansion capex: Spending that adds new leasable area, upgrades properties to a higher quality category, or funds new developments and acquisitions with the goal of increasing future income. Examples: - Adding two extra floors to an office building. - Converting a Class B office property into high-end Class A space with the expectation of significant rent increases. - Developing a new logistics facility on vacant land. - Acquisitions of new properties. > **Key Term: Growth capital expenditures** > Growth capital expenditures are discretionary investments that expand a REIT’s asset base or materially improve the quality or earning capacity of existing properties, such as development projects, major repositionings, or acquisitions. Only maintenance capex is deducted in AFFO. Growth capex is typically financed by retained cash, equity issuance, debt issuance, or asset sales and is evaluated within the context of the REIT’s capital allocation strategy. > **Exam warning:** Misclassifying expansion or development capex as maintenance capex will understate AFFO and can lead to incorrect conclusions about dividend capacity. Conversely, treating clearly recurring property upkeep as “growth” capex will overstate AFFO and make the dividend look safer than it is. In real life, the line between maintenance and growth can be blurred. For example: - A large refurbishment of an older shopping center: - The portion required to maintain safety and basic functionality (for example, structural repairs) is maintenance. - The portion that adds new features (for example, additional retail space, entertainment areas) is growth. In exam questions, the vignette will normally classify each capex item as “maintenance” or “expansion” to avoid ambiguity. Your task is to apply the classification correctly when computing AFFO. ### Straight-line Rent and Lease Incentives AFFO’s treatment of rental revenue is especially important for REITs with long leases and complex rent structures (for example, step-up rents, rent-free periods, or tenant improvement allowances): - Under accounting rules, fixed contractual escalations are often straight-lined over the lease term, so reported revenue may exceed cash rent in early years and be lower than cash rent in later years. - Tenant incentives such as rent-free periods or fit-out contributions are capitalized and amortized against revenue, again creating a wedge between accounting revenue and cash. - AFFO reverses these non-cash effects so that revenue reflects cash rent collected, making it easier to compare: - Properties at different points in the lease cycle. - REITs with different lease structures (for example, short-term multifamily versus long-term office leases). Ignoring this adjustment is a common source of error in dividend capacity analysis. ### Worked Example 1.3 A REIT’s FFO is 24 million. During the period: - Straight-line rent adjustment (non-cash revenue): 1.5 million - Maintenance capex: 4 million Assume no other adjustments. What is AFFO? > **Answer:** > Start from FFO, then deduct the non-cash rent component and maintenance capex. > > - FFO: 24.0 > - Less straight-line rent adjustment (non-cash revenue): −1.5 > - Less maintenance capex (cash outflow): −4.0 > > $$> \text{AFFO} = 24.0 - 1.5 - 4.0 = 18.5 \text{ million}$$ > > AFFO is lower than FFO because it reflects only cash-based rental income and deducts the sustaining capital required to keep properties income-producing. ### Company-Specific AFFO Definitions Unlike FFO, which is increasingly standardized by industry bodies, AFFO is not defined under IFRS or US GAAP and varies by company and analyst. Common company-specific adjustments include: - Subtracting all capitalized leasing costs, tenant improvements, and leasing commissions deemed “recurring,” consistent with typical lease rollover patterns. - Adjusting for amortization of above- or below-market leases acquired in business combinations (a non-cash item that affects rental revenue). - Adjusting for recurring straight-line ground lease expense (also non-cash). - Normalizing for recurring but uneven items (for example, significant property taxes paid in lump sums) based on multi-year averages. AFFO is therefore best understood as a family of definitions designed to approximate sustainable cash available for distribution. The CFA curriculum adopts a relatively conservative version that emphasizes recurring cash flows and excludes non-cash and clearly non-recurring items. From a broader financial reporting standpoint, remember that non-GAAP measures such as AFFO can be used either to improve transparency or to obscure poor performance. The curriculum’s emphasis on reconstructing AFFO yourself reflects the need to: - Understand exactly which items have been adjusted. - Judge whether those adjustments are justifiable and consistent with long-run cash generation. - Compare across REITs on a like-for-like basis rather than relying uncritically on management’s preferred metrics. > **Exam warning:** Exam questions will often specify the AFFO definition to use or list which items should be added or subtracted. Do not impose your own definition; follow the adjustments specified in the vignette even if they differ from what another company might do in practice. ### Worked Example 1.4 Starting from net income, an exam vignette provides the following for a REIT (in millions): - Net income attributable to common: 90 - Real estate depreciation and amortization: 50 - Gain on sale of properties: 10 - Impairment write-down of an office building: 8 - Straight-line rent recognized in excess of cash rent: 6 - Maintenance capex: 20 - Capitalized leasing commissions (recurring): 4 Compute FFO and AFFO. > **Answer:** > First compute FFO, then adjust to get AFFO. > Step 1: Compute FFO > > - Net income: 90 > - Add back real estate depreciation and amortization: +50 > - Add back impairment write-down (non-cash): +8 > - Subtract gain on property sale (non-recurring gain): −10 > > $$> \text{FFO} = 90 + 50 + 8 - 10 = 138 \text{ million}$$ > > Step 2: Compute AFFO > > - FFO: 138 > - Less straight-line rent adjustment (non-cash revenue): −6 > - Less maintenance capex: −20 > - Less recurring capitalized leasing commissions: −4 > > $$> \text{AFFO} = 138 - 6 - 20 - 4 = 108 \text{ million}$$ > > The 30 million difference between FFO and AFFO (138 − 108) represents non-cash revenue and recurring capital needs. AFFO is a more realistic measure of sustainable cash distributions than FFO for this REIT. ### FFO and AFFO in Dividend and Payout Analysis One of the most exam-relevant uses of FFO and AFFO is assessing dividend sustainability and growth capacity. ### Payout Ratios Based on FFO and AFFO Traditional payout ratios use net income, but for REITs, FFO or AFFO-based payout ratios are more informative. > **Key Term: FFO payout ratio** > FFO payout ratio is dividends to common shareholders divided by FFO over the same period. It measures what proportion of recurring earnings (before maintenance capex) is distributed as dividends. > **Key Term: AFFO payout ratio** > AFFO payout ratio is dividends to common shareholders divided by AFFO. It measures what proportion of estimated sustainable distributable cash is paid as dividends and is a key gauge of dividend safety. Typical interpretations (these are guidelines, not hard rules): - FFO payout ratio: - High (for example, >80%): REIT is returning most of recurring earnings; less retained cash to fund growth internally. - Low (for example, \<60%): more room to fund growth and protect the dividend, but in some jurisdictions this may reflect timing differences versus taxable income. - AFFO payout ratio: - Below ~80%: generally viewed as conservative; meaningful buffer for downturns and funding some growth. - Around 85%–95%: common for mature REITs; dividend is largely supported by current AFFO, but growth may require external capital if capex needs are high. - Above 100%: the REIT is paying out more than AFFO, implying reliance on asset sales, debt, or equity issuance to support the dividend; this is usually not sustainable. These thresholds can vary by property type and country. Short-lease sectors such as hotels or self-storage may target lower payout ratios due to higher cash flow volatility, whereas sectors with long leases (for example, triple-net lease REITs) can sometimes sustain higher ratios. ### AFFO and Dividend Sustainability Because AFFO approximates steady-state free cash flow to equity, the relationship between the dividend and AFFO is central: - If dividends consistently exceed AFFO: - The REIT is effectively returning capital, not just income. - Unless AFFO is expected to grow quickly, the dividend will likely be cut in a downturn or when external financing conditions tighten. - If dividends are comfortably below AFFO: - The REIT can fund some growth capex from retained AFFO. - It can also absorb temporary dips in AFFO without cutting the dividend. - If dividends are roughly equal to AFFO: - The dividend is “fully covered,” but there is limited internal funding capacity. - Growth will largely depend on external equity/debt issuance or asset recycling. Analytically, combine payout ratios with qualitative factors: - Lease duration and rent escalators. - Exposure to cyclical property types. - Balance sheet strength and access to capital markets. - Pipeline of development and acquisition projects. ### Worked Example 1.6 – CityCore REIT Dividend Analysis Revisit the CityCore REIT vignette from “Test Your Knowledge.” For convenience, the key data (in millions) are: - Net income attributable to common: 120 - Depreciation and amortization of real estate assets: 80 - Depreciation of corporate equipment: 4 - Gain on sale of an office building: 15 - Impairment write-down of a retail property: 6 - Straight-line rent revenue recognized in excess of cash rent: 5 - Recurring maintenance capex: 18 - Expansion (growth) capex: 40 - Capitalized leasing commissions and tenant improvements (recurring): 7 - Dividends to common: 110 - Shares outstanding: 50 million Assume all items except equipment depreciation are real estate–related. > **Answer:** > Step 1: Compute FFO > > - Net income: 120 > - Add back real estate depreciation and amortization: +80 > - Do not add back corporate equipment depreciation: 0 > - Add back real estate impairment (assumed non-cash): +6 > - Subtract gain on sale of an office building: −15 > > $$> \text{FFO} = 120 + 80 + 6 - 15 = 191 \text{ million}$$ > > FFO per share: > > $$> \text{FFO per share} = \frac{191}{50} = 3.82$$ > > Step 2: Compute AFFO > Starting from FFO: > > - FFO: 191 > - Less straight-line rent recognized in excess of cash rent (non-cash revenue): −5 > - Less recurring maintenance capex: −18 > - Less recurring capitalized leasing commissions and tenant improvements: −7 > - Ignore expansion capex (growth): 0 > > $$> \text{AFFO} = 191 - 5 - 18 - 7 = 161 \text{ million}$$ > > AFFO per share: > > $$> \text{AFFO per share} = \frac{161}{50} = 3.22$$ > > Step 3: Payout ratios > > - FFO payout ratio: > > $$> \text{FFO payout ratio} = \frac{110}{191} \approx 57.6\%$$ > > - AFFO payout ratio: > > $$> \text{AFFO payout ratio} = \frac{110}{161} \approx 68.3\%$$ > > Interpretation: CityCore’s dividend is well covered by both FFO and AFFO, with roughly one-third of AFFO retained (about 51 million). This retained AFFO is sufficient to fund current growth capex of 40 million with some buffer left. Dividend sustainability looks solid, but large incremental growth beyond the current plan will still require external financing or higher FFO/AFFO in the future. This example also illustrates common exam traps: - Do not add back non-real-estate depreciation (corporate equipment). - Do not subtract impairment from FFO if it is non-cash. - Treat straight-line rent in excess of cash rent as non-cash and remove it when computing AFFO. - Deduct only maintenance and recurring leasing-related capex, not growth capex. ### FFO/AFFO, Leverage, and Credit Analysis Beyond dividends, FFO and AFFO feed into key credit and leverage metrics widely used by lenders, rating agencies, and equity analysts. ### Debt and Coverage Ratios > **Key Term: Debt-to-FFO** > Debt-to-FFO is total debt (often net of cash) divided by annual FFO. It measures how many years of current FFO it would take to repay debt and is a leverage proxy commonly used in REIT credit analysis. > **Key Term: FFO interest coverage ratio** > FFO interest coverage ratio is (FFO + interest expense) divided by interest expense (or sometimes FFO divided by interest expense), indicating how many times recurring funds from operations cover current interest obligations. > **Key Term: Fixed-charge coverage ratio** > Fixed-charge coverage ratio extends interest coverage by including other fixed charges such as preferred dividends and ground lease payments in the denominator; the numerator typically includes EBITDA or FFO plus those fixed charges. Key interpretations: - Lower debt-to-FFO (for example, 4–6×) indicates more conservative leverage; higher ratios (for example, >8–9×) signal greater credit risk, all else equal. - Higher FFO interest coverage and fixed-charge coverage indicate more room to absorb interest rate increases, NOI volatility, or temporary vacancies. Exam vignettes may require: - Calculating these ratios based on provided balance sheet and income statement data. - Comparing two REITs’ leverage profiles and identifying which is better positioned in a downturn. - Linking leverage metrics to required returns and valuation multiples (higher leverage → higher equity risk premium → lower justified P/FFO and P/AFFO). ### Worked Example 1.7 – Debt-to-FFO and Coverage Assume a REIT reports: - Total debt: 2,400 million - Cash: 200 million - FFO: 400 million - Interest expense: 120 million - Preferred dividends: 20 million - Ground lease expense: 15 million Compute: 1. Net debt-to-FFO. 2. FFO interest coverage (using (FFO + interest) ÷ interest). 3. Fixed-charge coverage, using (FFO + interest + preferred dividends + ground lease expense) ÷ (interest + preferred dividends + ground lease expense). > **Answer:** > > - Net debt-to-FFO > > $$> \text{Net debt} = 2{,}400 - 200 = 2{,}200 \text{ million}$$ > > $$> \text{Net debt-to-FFO} = \frac{2{,}200}{400} = 5.5\times$$ > > - FFO interest coverage > > $$> \text{FFO interest coverage} = \frac{400 + 120}{120} = \frac{520}{120} \approx 4.33\times$$ > > - Fixed-charge coverage > - Fixed charges = 120 + 20 + 15 = 155 > - Numerator = FFO + interest + preferred dividends + ground lease expense > = 400 + 120 + 20 + 15 = 555 > > $$> \text{Fixed-charge coverage} = \frac{555}{155} \approx 3.58\times$$ > > Interpretation: Leverage of 5.5× FFO and coverage above 3× suggest a moderate risk profile. If a scenario or question indicates rising interest rates or a cyclical sector, you would consider whether these ratios leave sufficient buffer. In an item set, these ratios might be combined with qualitative information (for example, upcoming debt maturities, exposure to variable-rate debt, or development commitments) to assess downgrade risk or whether a REIT can comfortably fund its capex plan. ### Valuation Using FFO and AFFO FFO and AFFO play central roles in relative valuation of REITs, analogous to P/E and earnings yield for traditional companies. ### Price/FFO and Price/AFFO > **Key Term: P/FFO multiple** > P/FFO multiple is the current share price divided by FFO per share, analogous to a P/E multiple but based on FFO instead of earnings. > **Key Term: P/AFFO multiple** > P/AFFO multiple is the current share price divided by AFFO per share, often viewed as a closer proxy for the multiple of sustainable distributable cash flow. The intuition is the same as for justified P/E: - Higher expected growth in FFO/AFFO (g) → higher justified P/FFO and P/AFFO. - Higher required return on equity (r) or risk premium → lower justified P/FFO and P/AFFO. - Higher payout ratio relative to FFO/AFFO (if investors emphasize dividends) can also support higher multiples. Using a Gordon growth-type logic, if dividends are a fixed proportion of AFFO, analysts sometimes write: $$P_0 = \frac{\text{Div}_1}{r - g} = \frac{\text{Payout ratio} \times \text{AFFO}_1}{r - g}$$ Then: $$\text{Justified } \frac{P_0}{\text{AFFO}_1} = \frac{\text{Payout ratio}}{r - g}$$ This mirrors the justified P/E formula from the equity valuation reading, with AFFO per share taking the role of earnings per share. ### FFO and AFFO Yields > **Key Term: FFO yield** > FFO yield is FFO per share divided by the current share price (the inverse of P/FFO). It is analogous to an earnings yield and can be compared to bond yields and required equity returns. > **Key Term: AFFO yield** > AFFO yield is AFFO per share divided by the current share price (the inverse of P/AFFO). It approximates a “cash flow yield” on equity based on sustainable distributable cash. These yields are particularly useful for: - Comparing REIT valuations across sectors and markets. - Comparing REITs to long-term bond yields, adjusting for growth and risk. - Evaluating whether a REIT’s yield spread over government bonds is adequate given its credit and equity risk. ### Worked Example 1.8 – Multiples and Yields Using CityCore REIT from Worked Example 1.6: - FFO per share: 3.82 - AFFO per share: 3.22 - Current share price: 48 Compute CityCore’s P/FFO, P/AFFO, FFO yield, and AFFO yield. > **Answer:** > > - P/FFO: > > $$> \text{P/FFO} = \frac{48}{3.82} \approx 12.6\times$$ > > - P/AFFO: > > $$> \text{P/AFFO} = \frac{48}{3.22} \approx 14.9\times$$ > > - FFO yield: > > $$> \text{FFO yield} = \frac{3.82}{48} \approx 7.96\%$$ > > - AFFO yield: > > $$> \text{AFFO yield} = \frac{3.22}{48} \approx 6.71\%$$ > > Interpreting these numbers requires context: if peers trade at 15× P/FFO and 17× P/AFFO with similar growth and risk, CityCore may be relatively undervalued. If, however, CityCore has weaker growth prospects or higher leverage, the lower multiples could be justified. In exam questions, you may be asked to: - Compare a REIT’s multiples to peers and explain whether it appears rich or cheap, given differences in growth, risk, or asset quality. - Use a justified P/FFO or P/AFFO based on Gordon growth concepts to infer whether the current multiple is reasonable. ### Linking FFO/AFFO to Property-Level Metrics and NAV REIT equity valuation often combines: - Property-level valuation via NOI and capitalization rates, and - Company-level valuation via FFO/AFFO and multiples. > **Key Term: Capitalization rate (cap rate)** > Capitalization rate is a property-level yield defined as NOI in a given year divided by the property’s market value; rearranged, property value equals NOI divided by the cap rate. > **Key Term: Net asset value (NAV)** > Net asset value for a REIT is the estimated fair market value of assets (often derived by capitalizing stabilized NOI at market cap rates) minus liabilities, frequently expressed on a per-share basis. Basic steps in NAV-based valuation: - Estimate stabilized NOI for each property or segment. - Apply an appropriate market cap rate to derive property values. - Adjust for non-property assets and liabilities. - Divide by shares outstanding to get NAV per share. - Compare NAV per share to the current share price (premium or discount to NAV). Linking to FFO and AFFO: - NOI is before corporate G&A, interest, and taxes, whereas FFO is after these. - FFO can be approximated by: $$\text{FFO} \approx \text{NOI} - \text{corporate G\&A} - \text{interest expense} - \text{current taxes} + \text{real estate depreciation add-back} \pm \text{sales/impairment adjustments}$$ - AFFO further subtracts maintenance capex and non-cash rent items. Analytically: - If a REIT trades at a large discount to NAV but with a similar P/FFO to peers, it may indicate that: - The market questions the sustainability of NOI (for example, high lease rollover risk), or - The REIT has high overhead or leverage that reduces FFO/AFFO relative to NOI. - If a REIT trades at a premium to NAV and higher P/FFO, it may reflect: - Superior asset quality and expected NOI growth. - Strong balance sheet and management, justifying a lower required return (higher multiples). Understanding both NAV and FFO/AFFO multiples helps you connect property-level fundamentals to equity-level valuation in a coherent way. ### Macroeconomic Drivers, Discount Rates, and REIT Valuation The broader economics reading emphasizes that asset values are driven by: - Default-free interest rates across maturities. - The timing and magnitude of expected cash flows. - Risk premiums. These concepts apply directly to REITs. ### Components of the Required Return The required return on REIT equity can be decomposed into: - Real risk-free rate (linked to inter-temporal consumption preferences). - Expected inflation. - Equity risk premium for the market. - REIT- and sector-specific risk premiums (for example, leverage, property-type risk, tenant concentration, development risk). From the Grinold–Kroner style thinking in the equity reading, higher expected inflation and real growth initially raise discount rates; however, if REITs can pass through inflation via rent escalators, expected AFFO growth may offset some of the higher discount rate. Implications: - Rising real rates and/or risk premiums (for example, due to higher GDP volatility or risk aversion) tend to reduce justified P/FFO and P/AFFO. - If a REIT has strong inflation pass-through (for example, short-term leases or CPI-linked rents), its AFFO growth may partially hedge inflation, supporting higher multiples. ### Business Cycle and REIT Sensitivity From the economics reading: - In early expansions: - Short rates are low; yield curves are typically upward sloping. - Credit spreads narrow; cap rates may compress as investors accept lower real yields. - REITs often benefit from improving occupancy, rising rents, and cheaper funding. - In late expansions: - Short rates may rise as central banks tighten policy. - Yield curves may flatten or invert; credit spreads may start widening. - Highly levered REITs with significant variable-rate debt are vulnerable; FFO interest coverage may deteriorate. - In recessions: - Credit spreads widen; cap rates can rise if risk premiums increase. - NOI may fall as tenants default or downsize, particularly in cyclical sectors (for example, hotels, retail). - REITs with low debt-to-FFO and moderate payout ratios are better positioned to maintain dividends. An item set may combine macro information (for example, central bank policy, inflation trends, GDP expectations) with FFO/AFFO metrics, asking you to: - Adjust your required return and growth assumptions. - Judge whether current P/FFO or AFFO yields adequately compensate for changing risk and growth prospects. ### Common Exam Traps and Adjustments Several recurring pitfalls appear in Level 2 questions on REITs: ### 1. Misclassifying Depreciation and Amortization - Adding back all depreciation/amortization instead of only real estate–related items. - Forgetting that amortization of financing costs and depreciation of non-real-estate assets are not part of FFO, unless explicitly instructed. ### 2. Mishandling Property Sales and Impairments - Failing to remove gains or losses on property sales when computing FFO. - Treating impairment as a cash charge when the vignette clearly describes it as non-cash (in which case, add it back to FFO). - Double-counting adjustments (for example, both subtracting a gain and also adjusting for it elsewhere). ### 3. Confusing Maintenance and Growth Capex - Deducting all capex from FFO to compute AFFO, instead of only maintenance and recurring leasing capex. - Mislabeling a clearly expansionary project (for example, a new building) as maintenance. Exam questions often flag items as “maintenance,” “recurring,” “non-recurring,” or “expansion” to help you. ### 4. Misinterpreting Straight-line Rent Adjustments - Straight-line rent recognized “in excess of cash rent” means non-cash revenue has increased reported income above cash income. For AFFO, you subtract this excess. - Straight-line rent “less than cash rent” implies reported income is below cash; in that case, AFFO would add back the difference to align with cash flows. The vignette will usually provide the sign; read carefully. ### 5. Ignoring Company-Specific Definitions - Management may define “company FFO” or “normalized FFO” with proprietary adjustments. - In the exam, you must use the definition specified in the question, even if it differs from industry norms. - If the question asks you to compare your own FFO/AFFO calculation with management’s, you should identify and evaluate these differences (for example, whether they are reasonable or aggressive). ### 6. Inconsistent Treatment of Joint Ventures and Non-Controlling Interests - Forgetting to include the REIT’s proportionate share of joint-venture FFO when analyzing leverage or valuation on a “look-through” basis. - Failing to adjust FFO for the portion attributable to non-controlling interests when the question focuses on common shareholders. ### 7. Overlooking the Impact of Leverage on FFO - FFO is after interest; two REITs with similar NOI and properties can have very different FFO if leverage differs. - When comparing REITs, consider both asset quality (via NOI, cap rates, NAV) and capital structure (via debt/FFO, coverage ratios). A high P/FFO might be justified by low leverage and lower equity risk. ### Worked Example 1.9 – Identifying AFFO Misstatements A candidate computes AFFO for a REIT as follows (in millions): - Net income: 120 - Add back total depreciation and amortization (including real estate and corporate assets): +90 - Add back impairment: +5 - Subtract gain on sale of properties: −8 - Subtract total capex (maintenance 10, expansion 25): −35 - Subtract straight-line rent adjustment (cash rent exceeds GAAP rent by 3): −3 The candidate reports AFFO of 169 million. Identify and correct the main errors. > **Answer:** > First, understand the intended steps: net income → FFO → AFFO. > Errors: > > 1. The candidate adds back _all_ depreciation and amortization (90) instead of only real estate–related amounts. Suppose real estate depreciation is 80 and corporate depreciation is 10; only 80 should be added back to compute FFO. > 2. Total capex is deducted (maintenance 10 + expansion 25). AFFO should deduct only maintenance capex (10), not expansion capex (25). > 3. Straight-line rent adjustment: the question states that _cash rent exceeds GAAP rent by 3_. That means GAAP rent (and FFO) is _lower_ than cash; to move from FFO to AFFO (cash-based), you should **add** 3, not subtract it. > > Correct approach (assuming real estate depreciation 80 and corporate depreciation 10): > Step 1: FFO > > - Net income: 120 > - Add back real estate depreciation: +80 > - Add back impairment: +5 > - Subtract gain on sale: −8 > > $$> \text{FFO} = 120 + 80 + 5 - 8 = 197 \text{ million}$$ > > Step 2: AFFO > > - FFO: 197 > - Add straight-line rent adjustment (cash > GAAP by 3): +3 > - Subtract maintenance capex only: −10 > > $$> \text{AFFO} = 197 + 3 - 10 = 190 \text{ million}$$ > > The candidate’s 169 million AFFO materially understates distributable cash because of incorrect depreciation, capex, and straight-line rent treatment—exactly the types of errors tested at Level 2. ### Brief Note on Infrastructure and Similar Yield Vehicles The reading sits within “real estate and infrastructure.” Many listed infrastructure entities (for example, pipelines, utilities, or renewable energy yield vehicles) use non-GAAP metrics similar in spirit to FFO and AFFO, often labeled: - “Funds from operations” or “distributable cash flow.” - “Cash available for distribution.” However: - Definitions vary even more widely than in the REIT space. - The underlying assets (for example, regulated utilities or contracted power plants) have different risk and capex profiles compared with commercial property. - Exam vignettes involving infrastructure will define the relevant metrics explicitly; you should not automatically assume the REIT-style FFO/AFFO definitions. The analytical principles still apply: - Start from net income or CFO. - Adjust for non-cash charges, non-recurring items, and sustaining capex. - Use the resulting metric to assess dividend coverage, leverage, and valuation multiples. ## Key Point Checklist _This article has covered the following key knowledge points:_ - FFO is a sector-specific earnings metric for equity REITs that starts from net income and adjusts for real estate depreciation, property sales, and impairments to better capture recurring property-level earnings. - AFFO refines FFO by removing non-cash rent effects and deducting maintenance and recurring leasing capex, approximating sustainable cash available for distribution to equity holders. - Only real estate–related depreciation and tenant intangible amortization should be added back in FFO; non-real-estate depreciation and financing cost amortization are not added back unless explicitly instructed. - Gains and losses on sales of depreciable properties are excluded from FFO, and non-cash real estate impairment charges are typically added back. - Maintenance capex and recurring capitalized leasing costs are deducted in AFFO, whereas discretionary growth and development capex are excluded from AFFO calculations. - Straight-line rent adjustments are reversed when moving from FFO to AFFO: non-cash revenue recognized above cash rent is subtracted; when GAAP rent is below cash, the difference is added. - FFO and AFFO payout ratios (dividends divided by FFO or AFFO) are central to analyzing dividend sustainability, internal funding capacity, and room for dividend growth. - Leverage and credit metrics such as debt-to-FFO, FFO interest coverage, and fixed-charge coverage ratios use FFO as a denominator and help assess balance sheet strength and refinance risk. - P/FFO, P/AFFO, FFO yields, and AFFO yields are REIT-specific valuation tools analogous to P/E and earnings yield, and can be interpreted using Gordon growth and justified multiple concepts. - REIT equity valuation often combines property-level analysis via NOI and cap rates with company-level analysis via FFO/AFFO and NAV per share. - Macroeconomic conditions (interest rates, inflation, GDP growth, and risk premiums) affect REIT discount rates, cap rates, and expected FFO/AFFO growth, influencing justified valuation multiples. - Common exam traps include misclassifying depreciation and capex, mishandling straight-line rent, ignoring non-controlling interests, and blindly accepting company-specific FFO/AFFO definitions without adjustment. ## Key Terms and Concepts - Real estate investment trust (REIT) - Equity REIT - Mortgage REIT - Net operating income (NOI) - Funds from operations (FFO) - Adjusted funds from operations (AFFO) - FFO per share - Straight-line rent adjustment - Maintenance capital expenditures - Growth capital expenditures - FFO payout ratio - AFFO payout ratio - Debt-to-FFO - FFO interest coverage ratio - Fixed-charge coverage ratio - P/FFO multiple - P/AFFO multiple - FFO yield - AFFO yield - Capitalization rate (cap rate) - Net asset value (NAV)