Pollution and Human Health - Challenges linking pollution an…
Learning Outcomes
- Explain why linking pollution to a health outcome is often scientifically difficult
- Distinguish between hazard identification, exposure assessment, dose-response assessment, and risk characterization
- Identify major routes of exposure, including inhalation, ingestion, and dermal absorption
- Explain the difference between correlation and causation in pollution-health studies
- Describe how confounding variables, co-exposures, and latency periods complicate causal claims
- Understand why susceptible populations can experience stronger health effects from the same pollutant
- Apply dose and exposure ideas using a simple worked example
- Use exam-ready chains such as source → pathway → route → dose → effect
AP Environmental Science Syllabus
For the AP Environmental Science, you are expected to understand challenges linking pollution and human health, with a focus on the following syllabus points:
- Know that pollution can clearly harm health, but proving that one pollutant caused one disease is often difficult
- Identify the main routes of exposure: inhalation, ingestion, and dermal absorption
- Explain the difference between acute and chronic exposure and how each affects health outcomes
- Understand the role of confounding variables such as smoking, occupation, age, and socioeconomic status
- Explain why co-exposures and multiple risk factors make attribution to a single pollutant difficult
- Interpret dose-response ideas, including threshold dose and why dose matters as well as pollutant type
- Understand why surveillance data can show patterns and hotspots but cannot by itself prove causation
- Describe why children, older adults, pregnant people, and people with existing illness may be more vulnerable
Test Your Knowledge
Attempt these questions before reading this article. If you find some difficult or cannot remember the answers, look more closely at that area during your revision.
- Why does finding a pollutant in air, water, blood, or urine not automatically prove it caused disease?
- What is the difference between correlation and causation in a pollution-health study?
- Name three major routes by which pollutants enter the human body.
- How can a confounding variable make a pollutant look more harmful or less harmful than it really is?
- Why might children and older adults show stronger health effects from the same exposure?
Introduction
Pollution and health is a high-yield AP Environmental Science topic because it links chemistry, biology, public health, and data interpretation. The key idea is simple: pollutants can damage human health, sometimes severely. The difficult part is proving exactly how much harm came from one pollutant in one real population.
That difficulty exists because people are not exposed to just one thing at one time. They breathe mixtures of air pollutants, drink water from different sources, eat different diets, move between places, and have different ages, medical histories, jobs, and living conditions. This means APES questions often reward students who can explain not just that pollution is harmful, but why evidence is sometimes uncertain.
Key Term: risk
The likelihood that a person will become ill after exposure to a toxin or pathogen.
Introduction to the challenge: from pollutant to disease
To connect pollution to health, scientists have to build a chain of evidence. They need to know the source of the pollutant, how it moved through the environment, how people contacted it, how much entered the body, and what effect followed. If any link in that chain is unclear, the health conclusion becomes weaker.
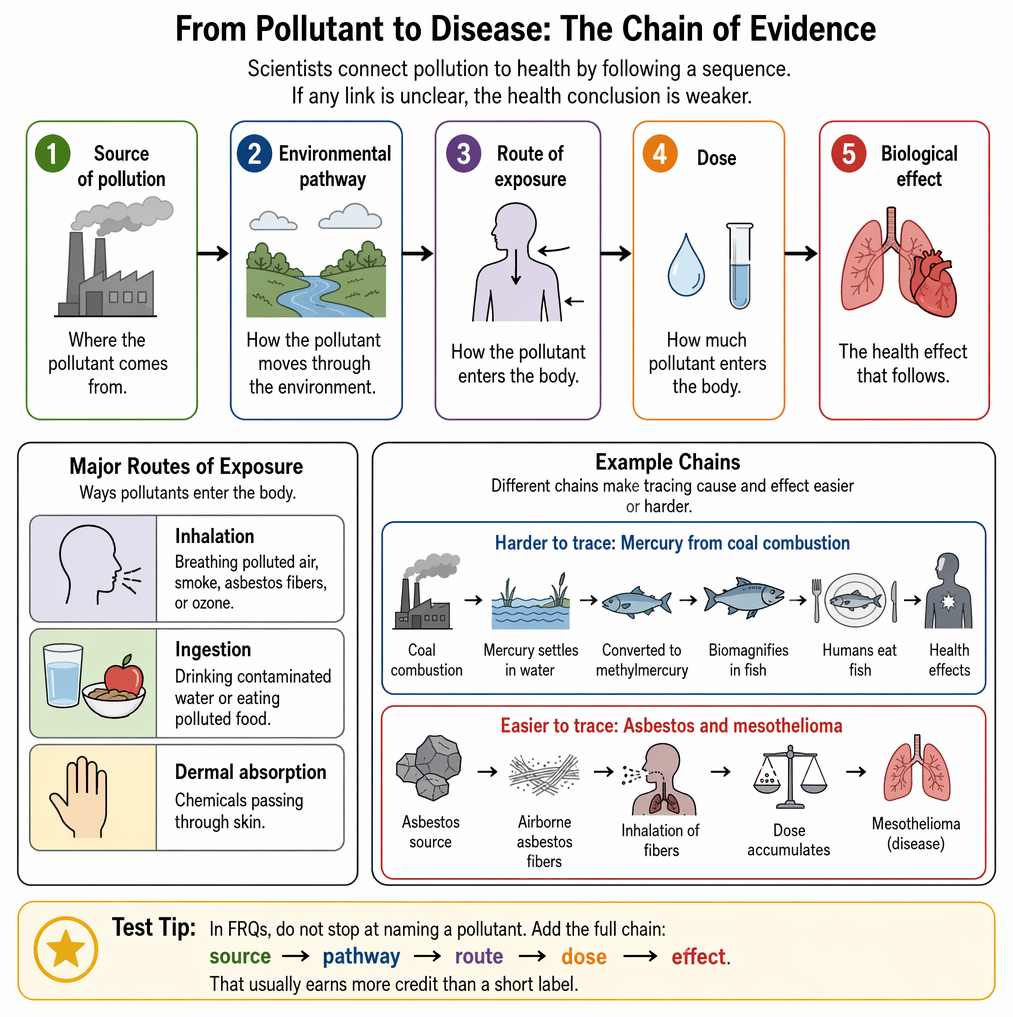
Environmental transport, exposure routes, absorbed dose, and health effects are presented as linked steps in evaluating pollution-related risk.
Key Term: exposure pathway
The route a pollutant takes from its source through the environment to a person.
A strong APES answer often uses this sequence:
- source of pollution
- environmental pathway
- route of exposure
- dose
- biological effect
For example, mercury from coal combustion does not usually harm people the moment it leaves a smokestack. Instead, it can settle into water, be converted into methylmercury, enter aquatic food webs, biomagnify in fish, and then affect humans who eat those fish. That long chain makes tracing cause and effect harder than in a simple poisoning event.
Key Term: route of exposure
The way a pollutant enters the body, such as inhalation, ingestion, or dermal absorption.
The three major exposure routes are:
- Inhalation: breathing polluted air, smoke, asbestos fibers, or ozone
- Ingestion: drinking contaminated water or eating polluted food
- Dermal absorption: chemicals passing through skin
Some pollutants are easier to connect to disease because the route is clear and the disease is strongly associated with the pollutant. Asbestos and mesothelioma are a classic example. The source, route, and disease link are unusually strong. But most real-world cases are less direct.
Test Tip: In FRQs, do not stop at naming a pollutant. Add the full chain: source → pathway → route → dose → effect. That usually earns more credit than a short label.
Why causation is hard to prove
Correlation is not the same as causation
If a polluted city has high asthma rates, that is an association. It does not automatically prove the pollution caused the asthma. Maybe the city also has higher smoking rates, more traffic, older housing with mold, or less healthcare access. Those other factors may also affect the disease pattern.
Key Term: correlation
A relationship in which two variables change together, without necessarily proving that one causes the other.
Pollution-health research often relies on observational studies because it would be unethical to deliberately expose people to harmful pollutants in controlled experiments. That means scientists often work with evidence that is suggestive rather than perfect.
Suppose researchers find that people living near major roads have more respiratory illness. That may reflect nitrogen dioxide, ozone precursors, and particulate matter from vehicles. But it may also reflect income differences, housing quality, noise, or stress from living near heavy traffic. So the observed pattern is useful, but not definitive on its own.
Confounding variables distort the picture
Key Term: confounding variable
A factor linked both to the exposure and to the health outcome that can distort the apparent relationship between them.
A confounder can make a pollutant appear more dangerous than it really is, or hide part of its effect.
Example:
- Workers in an industrial area have high lung disease rates.
- You suspect factory air pollution.
- But many workers may also smoke.
- Smoking is linked to lung disease and may be more common in that exposed group.
If smoking is not accounted for, pollution may seem entirely responsible when the real explanation is shared between pollution and smoking.
Common confounding variables include:
- smoking
- age
- occupation
- preexisting disease
- socioeconomic status
- housing quality
- access to healthcare
- diet
- local climate and heat
- exposure to other pollutants
This is why APES exam answers should avoid simplistic claims like “the pollutant caused the disease.” Better wording is “the pollutant may have contributed to increased risk.”
Co-exposures and multiple risk factors
In real life, people are exposed to mixtures. Someone may inhale ozone and particulates, drink water with nitrates, and also work near solvents. These are co-exposures. They make it difficult to isolate the effect of one pollutant.
This matters because some diseases have many causes. Cardiovascular disease, respiratory illness, and cancer often reflect a combination of genetics, lifestyle, age, and environmental exposure. Pollution may be one contributor among several.
Lead and mercury show this well. Both can damage the nervous system, especially in children. But if a child also experiences poor nutrition, inadequate housing, or limited medical care, it becomes harder to separate the exact contribution of the pollutant from the contribution of other disadvantages.
Exposure, dose, and timing
Why measuring exposure is difficult
Scientists do not usually know each person's full lifetime exposure. They often estimate exposure using:
- monitoring stations
- residence location
- workplace information
- modeled pollutant concentrations
- environmental sampling
- biomonitoring of blood or urine
But these are imperfect.
A person may live in one neighborhood, work in another, commute through a third, and spend time indoors where pollutant levels differ from outdoor levels. So a citywide air monitor may not match that person's true exposure.
Key Term: exposure assessment
The process of estimating how much of a pollutant reaches a person or population, by what route, how often, and for how long.
This is one of the main reasons pollution-health studies can be uncertain. If exposure is estimated badly, the study may miss a real effect or exaggerate one.
Acute versus chronic exposure
Key Term: acute exposure
A short-term exposure, often at a relatively high level, that can produce rapid health effects.
For exam questions, a sudden illness after one large dose points toward examples such as carbon monoxide poisoning, whereas symptoms linked to repeated indoor VOC exposure suggest cumulative harm. Indoor pollutant concentrations can be two to five times higher than outdoors, so ventilation and the length of time spent indoors are useful clues when identifying chronic exposure.
Key Term: chronic exposure
A long-term or repeated exposure, often at lower levels, that may cause delayed or cumulative harm.
Acute exposure is easier to link to health because timing is obvious. Carbon monoxide poisoning in an enclosed space can cause symptoms quickly. Chronic exposure is harder because disease may appear years or decades later.
Asbestos is again a strong example. Exposure may happen in one decade, but mesothelioma can develop decades later. Lead exposure in childhood may later be linked to developmental and learning problems, but those outcomes can also be influenced by education, nutrition, and home conditions.
That delay between exposure and illness is called latency, and it is one of the biggest reasons cause-and-effect claims are challenging.
Worked example: simple ingestion dose
A simplified ingestion dose equation is:
Dose = (C × IR × EF × ED) / (BW × AT)
Where:
- C = concentration
- IR = intake rate
- EF = exposure frequency
- ED = exposure duration
- BW = body weight
- AT = averaging time
Worked example:
A child drinks water containing a pollutant at 2 mg/L. They drink 1 L/day. Exposure happens 200 days/year for 2 years. Body weight is 20 kg. Averaging time is 730 days.
Step 1: Multiply the top values Dose numerator = 2 mg/L × 1 L/day × 200 days/year × 2 years
Step 2: Multiply the bottom values Dose denominator = 20 kg × 730 days Dose denominator = 14,600 kg·day
Step 3: Divide Dose = 800 mg / 14,600 kg·day
Approximate answer: 0.055 mg/kg-day
Why this matters: the concentration in water alone does not tell the whole story. Dose also depends on body size, how much is consumed, and for how long.
Test Tip: In calculation questions, show units at every step. APES scoring often rewards setup and method, not just the final number.
Dose-response and threshold issues
A pollutant’s danger depends on dose, not just presence.
Key Term: dose-response relationship
The relationship between the amount of exposure to a substance and the size or severity of the biological response.
A dose-response curve shows what happens as dose increases. Some substances have a threshold dose, below which no obvious harmful effect is observed. Others, especially carcinogenic risks, may be treated more cautiously.
Different pollutants can produce different curves:
- one may show effects only after a certain threshold
- another may produce increasing effects across a wide range
- one may be more potent, shown by a steeper curve
This helps explain why “pollution” is too broad a word by itself. The health impact depends on pollutant type, concentration, frequency, duration, and the person exposed.
Why some people are more vulnerable
Not everyone has the same risk from the same pollutant.
Key Term: susceptible population
A group more likely to be harmed by an exposure because of age, health status, biology, or social conditions.
Common susceptible populations include:
- children
- older adults
- pregnant people and fetuses
- people with asthma or COPD
- people with heart disease or diabetes
- low-income communities
- outdoor workers
- people near roads, industry, or wildfire-prone areas
Children are especially vulnerable because:
- they have smaller body mass, so the same intake can mean a higher dose per kilogram
- organs and nervous systems are still developing
- they may breathe faster or show more hand-to-mouth behavior
Older adults and people with existing disease may be less able to tolerate respiratory or cardiovascular stress from pollutants like ozone, sulfur dioxide, or particulates.
Low-income communities may face both higher exposure and fewer protective resources. They may live closer to industrial areas, busy roads, or older buildings with lead or mold, while also having less access to healthcare.
This is why equal exposure does not always mean equal harm.
Using evidence carefully on the exam
Surveillance systems and public health maps are useful because they reveal patterns. They can show where hazards, exposures, and disease rates overlap. But they do not automatically prove that one caused the other.
For instance, if a map shows higher asthma rates in an urban area with high traffic pollution, that supports a hypothesis. It does not by itself prove that traffic pollution caused each case.
A stronger causal argument combines several lines of evidence:
- exposure data
- dose-response patterns
- toxicology or biological mechanism
- timing, showing exposure came before disease
- repeated findings across studies
- health improvement when pollution decreases
Natural experiments are especially persuasive. If air pollution falls after policy changes and respiratory illness also falls, that strengthens the case that the pollutant mattered.
A good APES explanation model
When asked why pollution-health links are difficult, a strong answer usually includes three or four of these:
- people experience multiple exposures
- diseases may have long latency periods
- observational studies show correlation more easily than causation
- confounding variables affect both exposure and disease
- exposure is often estimated, not directly measured
- susceptibility differs among populations
That is more convincing than a vague statement like “it is hard to know.”
Key Point Checklist
This article has covered the following key knowledge points:
- Pollution can clearly harm health, but proving that one pollutant caused one illness is often difficult
- Scientists often use a source → pathway → route → dose → effect chain to explain pollution-health links
- The main routes of exposure are inhalation, ingestion, and dermal absorption
- Exposure assessment estimates how much pollutant reaches a person, how often, and for how long
- Correlation does not by itself prove causation
- Confounding variables such as smoking, occupation, age, and income can distort observed relationships
- Co-exposures make it difficult to isolate the effect of a single pollutant
- Acute exposure is short-term and often easier to link to symptoms, while chronic exposure may cause delayed effects
- Latency periods make long-term diseases harder to trace back to a pollutant
- Dose-response ideas help explain why amount of exposure matters, not just presence of a chemical
- Susceptible populations such as children, older adults, and people with existing illness may suffer stronger effects
- Surveillance data can reveal patterns and hotspots, but stronger causal claims need multiple lines of evidence
Key Terms and Concepts
- risk
- exposure pathway
- route of exposure
- correlation
- confounding variable
- exposure assessment
- acute exposure
- chronic exposure
- dose-response relationship
- susceptible population